PostHog
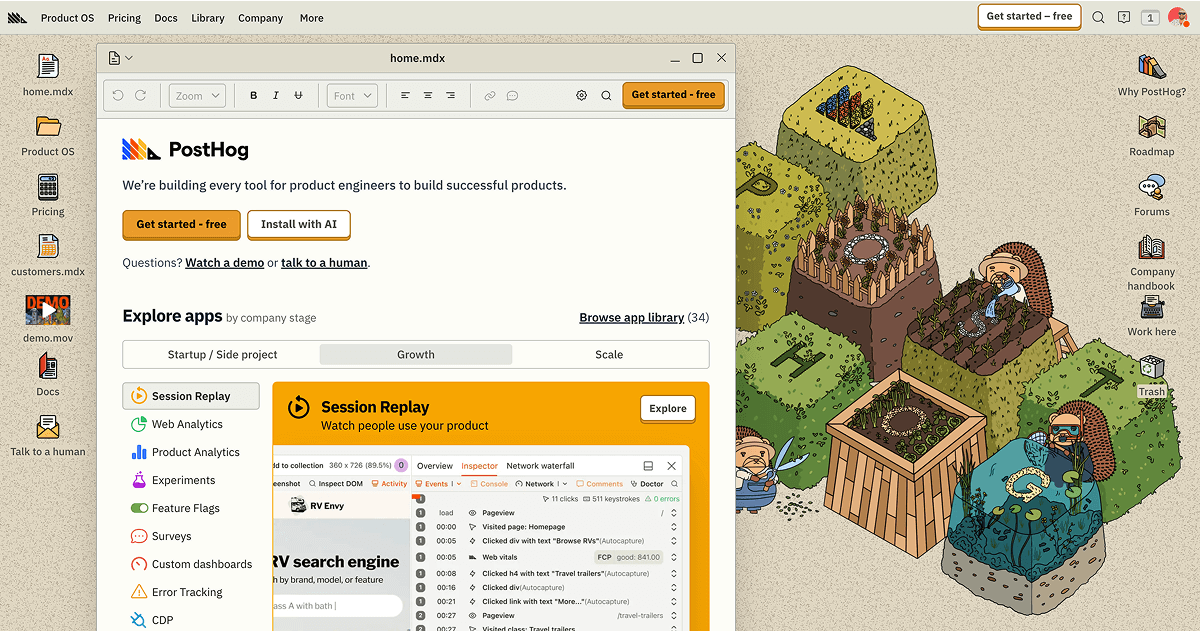
PostHog has released distributed tracing in alpha, bringing the open-source analytics platform one step closer to offering a complete observability suite. The feature joins logs, errors, and metrics to provide developers with end-to-end visibility into application performance within a single tool.
The tracing capability, announced on LinkedIn by Abheek Basu, who leads PostHog's Observability and Application Performance Monitoring team, marks a significant expansion of the platform's monitoring capabilities. Distributed tracing allows developers to track requests as they move through microservices and distributed systems, making it easier to diagnose performance bottlenecks and identify failure points.
Why Tracing Matters for Modern Applications
As applications have shifted from monolithic architectures to distributed systems, understanding how requests flow through multiple services has become critical. Traditional logging and error tracking can show what went wrong, but tracing reveals the full journey of a request across services, databases, and APIs.
PostHog's implementation aims to consolidate what traditionally requires multiple vendor solutions. Teams using tools like Datadog, New Relic, or Sentry often juggle separate products for each observability pillar. By bundling traces with its existing product analytics, session replay, and feature flag capabilities, PostHog offers a unified workflow for both product and engineering teams.
The alpha release follows several AI-powered additions to PostHog's platform, including automated error triage and session replay analysis. While those features focus on automating diagnosis, tracing provides the raw instrumentation data that makes such automation possible.
What's in the Alpha
PostHog's tracing implementation follows OpenTelemetry standards, which means it should work with existing instrumentation libraries across multiple languages and frameworks. Developers can visualize request flows, measure latency at each service hop, and correlate traces with user sessions captured in PostHog's session replay.
The alpha designation signals that the feature is functional but still under active development. PostHog typically moves features through alpha and beta stages before general availability, gathering user feedback to refine the interface and expand compatibility.
Because PostHog is open-source, teams can self-host the tracing infrastructure alongside their existing PostHog deployment, avoiding data egress costs and maintaining control over sensitive performance data. This approach contrasts with cloud-only APM vendors, where high-volume tracing data can generate substantial bills.
The Path to Full Observability
With tracing now in alpha, PostHog has four core observability signals in various stages of maturity. Error tracking has been available for several months, while logs and metrics have been part of the platform's data warehouse capabilities. The company positions itself as an alternative to stitching together Supabase for databases, Vercel for hosting, and separate monitoring stacks.
The move reflects broader industry consolidation around observability. Startups and small teams increasingly prefer integrated platforms over best-of-breed point solutions, trading some specialization for reduced overhead and unified data models. PostHog's product analytics heritage gives it a different entry point than traditional APM vendors, appealing to teams that want to connect user behavior directly to system performance.
Developers interested in testing the alpha can access tracing through PostHog's documentation. The company has not announced a timeline for moving the feature to beta or general availability.
Sources
1 checkedHow we cover tool news: Create With's tool desk drafts these reports with AI from the sources listed above and checks them against those sources before publishing.


 Supabase